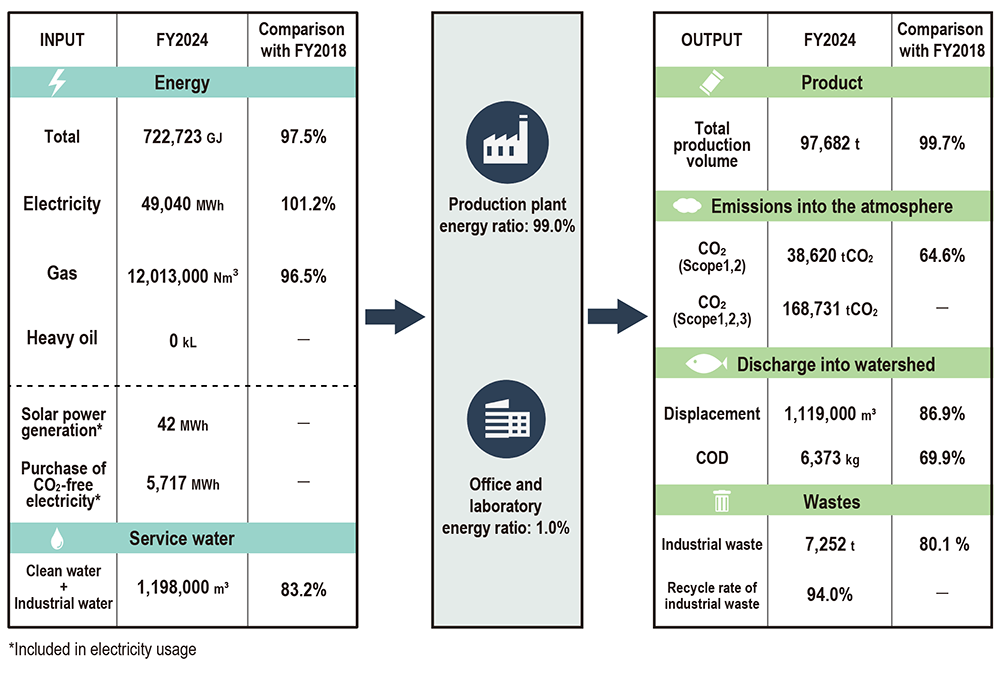
Nagase Viita regularly monitors the environmental impacts associated with our business activities to reduce the use, emission, and disposal of valuable resources.
Performance Comparison between FY2024 and FY2018
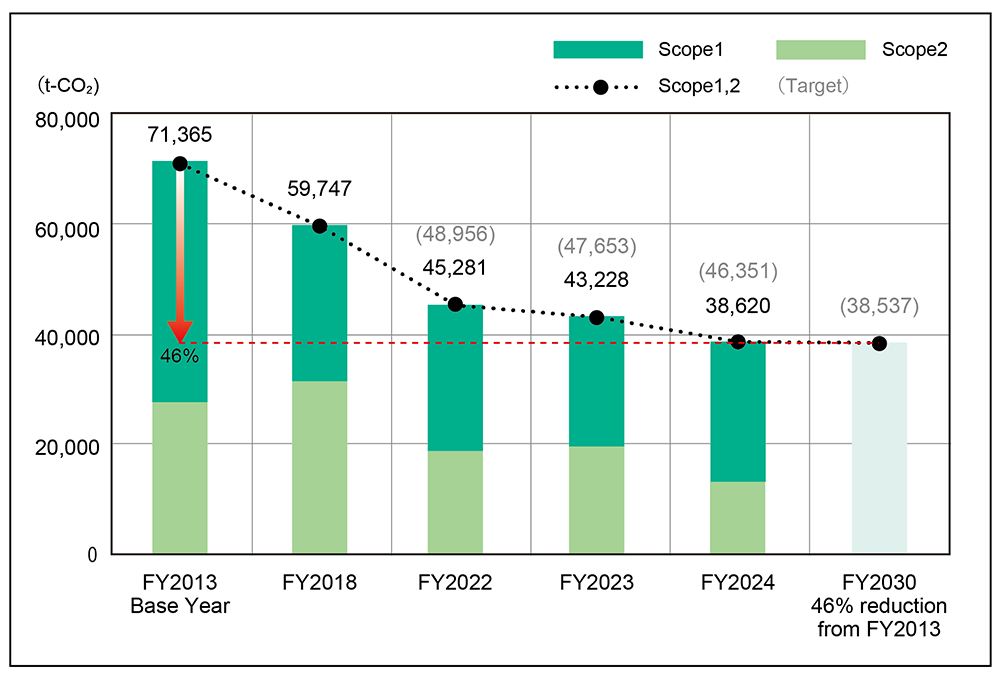
Changes in CO2 Emissions
FY2013 Base Year
FY2018
FY2022
FY2023
FY2024
CO2(t-CO2): Scope1
43,770
28,337
26,529
23,661
25,460
CO2(t-CO2): Scope2
27,595
31,371
18,753
19,567
13,160
CO2(t-CO2): Scope1,2
71,365
59,747
45,281
43,228
38,620
CO2(t-CO2): Scope3
66,387
77,637
61,740
70,033
130,111
CO2(t-CO2): Scope3 (upstream emissions)
66,291
77,432
61,606
69,879
129,897
CO2(t-CO2): Scope1,2,3
137,751
137,384
107,022
113,261
168,731
Unit Scope 1,2(t-CO2/t)
0.71
0.61
0.44
0.47
0.40
Scope1: Direct greenhouse gas emissions by the reporting company itself. (eg. fuel combustion,industrial process)
Scope2: Indirect emissions from the use of electricity, heat, or steam supplied by others.
Scope3*: Indirect emissions other than Scope 1 and Scope 2 (Emissions by others related to the company's activities).
Scope3 (upstream emissions): Category 1~8 (Emissions mainly from purchased goods and services)
*Scope3: The calculation method for Scope 3 has been revised to comply with SBT standards from the FY2024 results.