Lipid Droplet Staining (Blue, Green, Red, Deep Red)

Lipid Droplet Staining (Blue, Green, Red, Deep Red)
Lipi probes are small molecule which emit strong fluorescence in hydrophobic environment such as in LDs.
Lipid droplets (LDs) are composed of neutral lipids such as triacylglycerol & cholesteryl ester that are surrounded by phospholipid monolayers and are seen ubiquitously, not only in adipocytes1). LDs were originally thought to serve as a lipid storage unit, until a recent study showing that LDs play an important role in regulating lipid metabolism, autophagy2) and cellular senescence3). Therefore, LDs have gained great attention as an important tool to elucidate the mechanisms of their formation, growth, fusion, and retraction.
Product information
Lipid droplet staining fluorescent reagent

1) T. Fujimoto et al., “Lipid droplets: a classic organelle with new outfits.” Histochem Cell Biol., 2008, 130(2), 263.
2) R. Singh et al., “Autophagy regulates lipid metabolism.” Nature, 2009, 458(7242), 1131.
3) M. Yokoyama et al., “Inhibition of endothelial p53 improves metabolic abnormalities related to dietary obesity.” Cell Reports, 2014, 7(5), 1691.
For more information on Lipi-series and examples, please refer to the publication below:
4) Tatenaka, Y. et al., “Monitoring Lipid Droplet Dynamics in Living Cells by Using Fluorescent Probes” Biochemistry.“, 2019, 58(6), 499-503.
Notes: Lipi-Series is Patent Pending.
Technical info
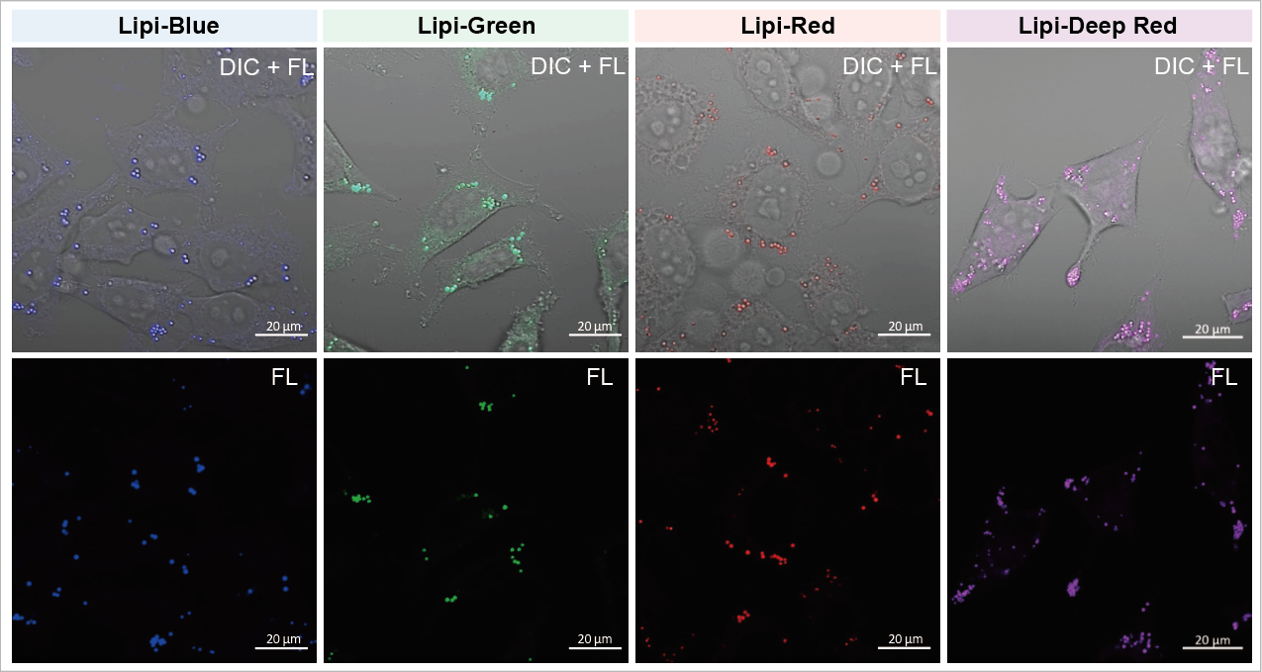
A medium that contained oleic acid (200 μmol/l) was added and incubated overnight. Then, the supernatant was removed and the cells were washed with PBS. Each Lipi product series (1 μmol/l) was added and the cells were incubated for 15 minutes.
Lipi-Blue: Ex. 405 nm / Em. 450 – 500 nm
Lipi-Green: Ex. 488 nm / Em. 500 – 550 nm
Lipi-Red: Ex. 561 nm / Em. 565 – 650 nm
Lipi-Deep Red: Ex.640 nm / Em.650-700 nm
Reagent Comparison

*Leaks in GFP filter
High Intracellular Retentivity
Live HepG2 cells were stained with each of the Lipi products, Nile Red, and Reagent B.
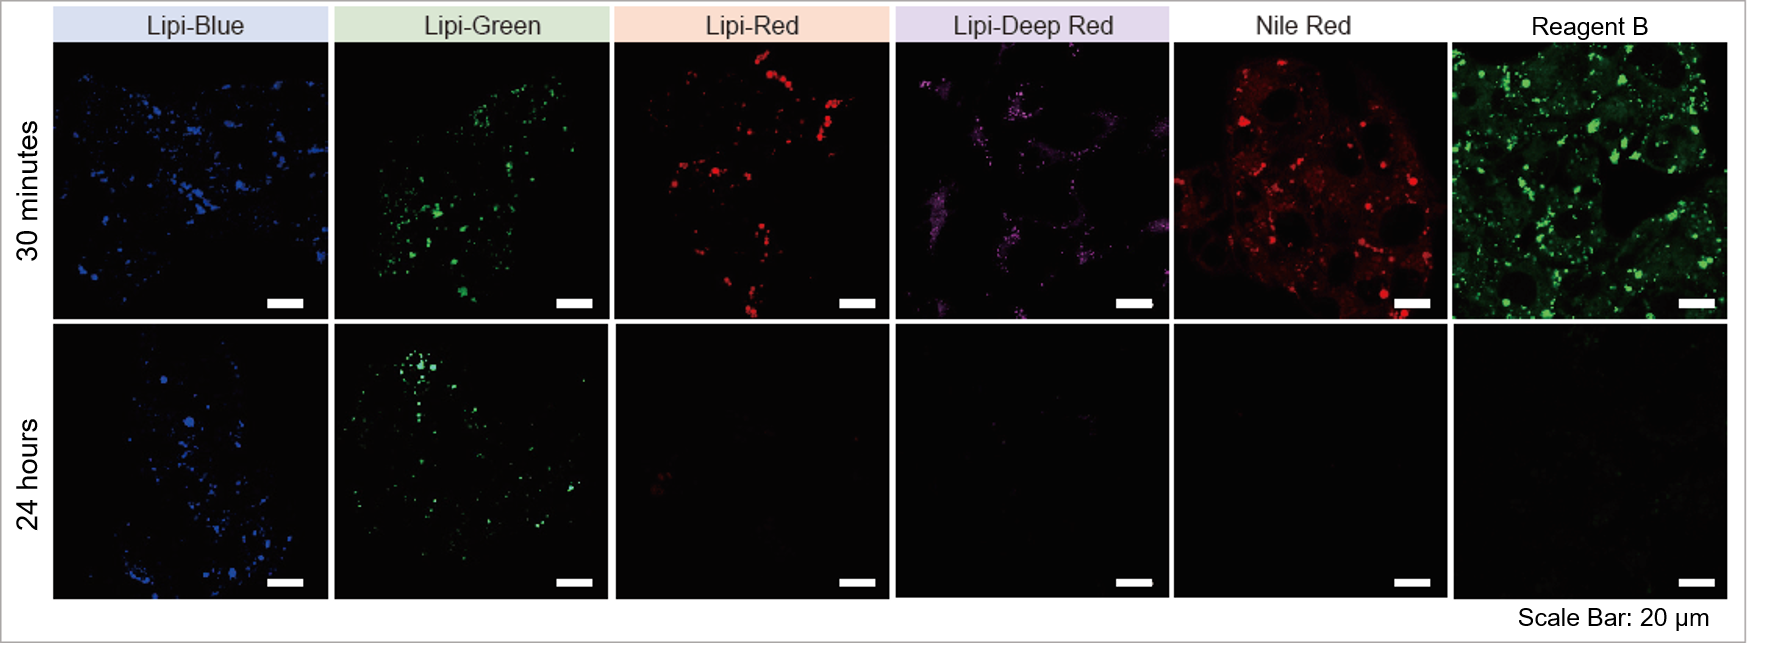
Lipi-Blue and Lipi-Green had higher retention in cells after 24 hours post staining than Lipi-Red, Nile Red, and Reagent B.
High Correlation with Antibody Detection Method: Lipi-Blue (LD01)
After fixing HepG2 with 4% PFA, cells are stained with 100 nmol/l Lipi-Blue. Then, Adipophilin (ADFP) expressed on lipid-droplet membrane was labeled with anti-ADFP antibody
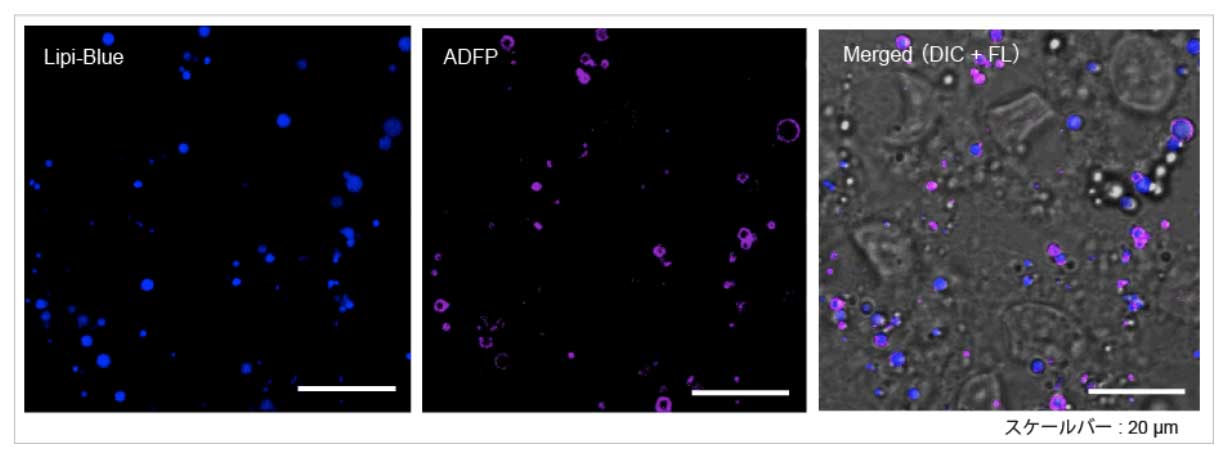
Scale Bar: 20 μm
Lipi-Blue: Ex. 405 nm / Em. 450 – 500 nm
Anti-ADFP antibody (Alexa Fluor® 647): Ex. 640 nm / Em. 650 – 700 nm
High Selectivity toward Lipid Droplet
Live HeLa cells were treated with Oleic acid and were stained with 100 nmol/l Lipi-Blue and 100 nmol/l Nile Red. Nile red had high background due to the limit in selectivity toward lipid droplets.
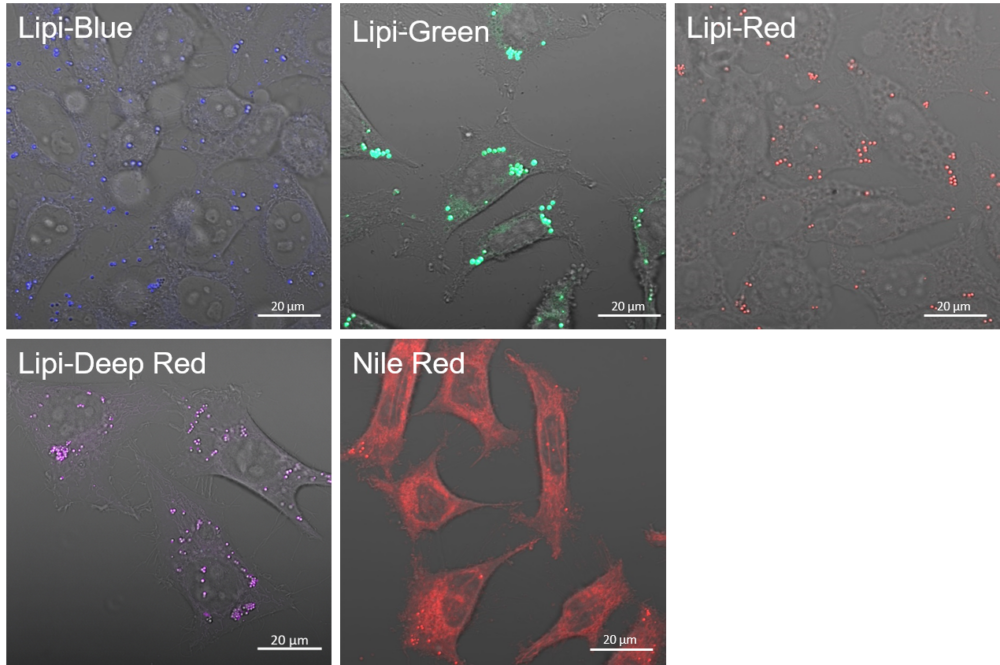
Lipi-Blue: Ex. 405 nm / Em. 450 -500 nm
Lipi-Green: Ex. 488 nm / Em. 500 – 550 nm
Lipi-Red: Ex. 561 nm / Em. 565 – 650 nm
Lipi-Deep Red: Ex. 640 / Em. 650 – 700 nm
Nile Red: Ex. 561 nm / Em. 565 – 650 nm
Filter Leakage Rate (Lipi-Red vs Nile Red)
HepG2 cells were stained with Lipi-Red and Nile Red. Lipi-Red was imaged with Green excitation (G), but not Blue excitation (B). However, Nile Red was imaged in both filter. Lipi-Red is preferable for multi-staining.

Multiple Staining: Lipi-Deep Red (Purple) co-staining with GFP fluorescence (green) in HeLa cells
After adding Lipi-Deep Red (0.1 μmol/l) to the Arf4-GFP expressed Hela cells and the cells were incubated for 30 minutes, the cells were treated with 4% PFA (PBS) to fix, and washed with PBS three times. Fluorescent imaging was conducted by confocal microscopy.
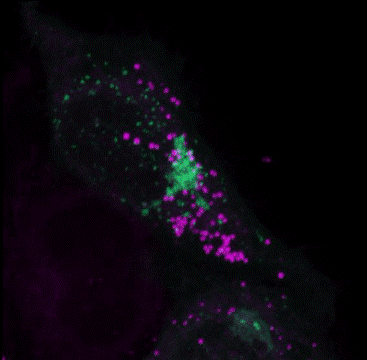
GFP: Ex/Em=488/400-552 nm
LDs: Ex/Em=640/630-700 nm
Multiple Staining: Lipi-Deep Red (RED) co-staining with GFP fluorescence (green) in HeLa cells
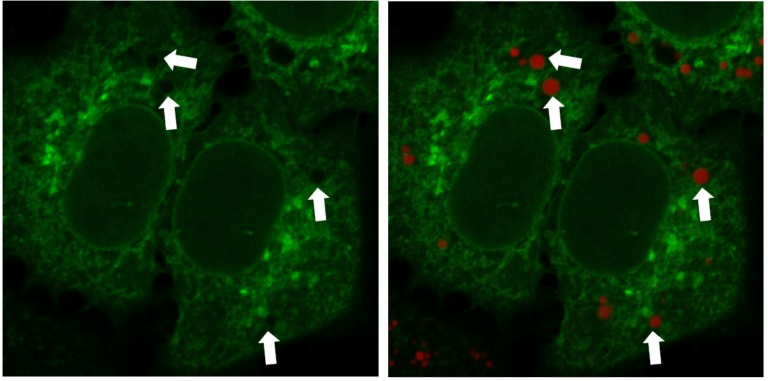
*Data was kindly provided by Dr. G. Belov, at University of Maryland, College Park
Multiple Staining: Reference
1) Sample: Brown Adipocytes
Multiple Staining: Co-stained with MitoBright Green (Mitochondria), Hoechst 33342 (Nuclear) and Lipi-Red
Reference: Masako, O. et al., “Exogenous Cytokine-Free Differentiation of Human Pluripotent Stem Cells into Classical Brown Adipocytes”, Cells. 2019, 8(4), 373.
2) Sample: hMGEC
Multiple Staining: Co-stained with tandem RFP-GFP-tagged LC3B (autophagosome /autophagolysosome) and Lipi-Blue
Reference: Kim, S. et al., “Eicosapentaenoic acid (EPA) activates PPARγ signaling leading to cell cycle exit, lipid accumulation, and autophagy in human meibomian gland epithelial cells (hMGEC)“, The Ocular Surface, 2020, 18(3), 427-437.
3) Sample: AdMSCs
Multiple Staining: Co-stained with UCP1 antibody (Alexa Fluor 488), DAPI (Nuclear) and Lipi-Red
Reference: Yukimasa, T. et al.,”Transcriptome analysis reveals brown adipogenic reprogramming in chemical compound-induced brown adipocytes converted from human dermal fibroblasts”, Scientific Reports, 2021, 11, 5061.
scrollable
Adipocyte with Lipi Series
Lipid droplets in adipocyte were clearly detected by staining adipocytes, derived from 3T3-L1 preadipocytes, with Lipi-Series.
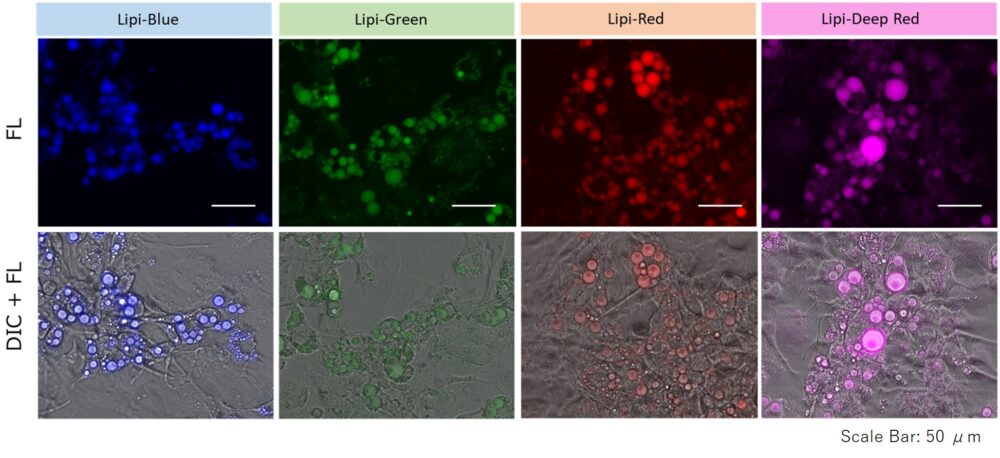
1. HeLa cells were seeded on a μ-slide 8-well plate and cultured at 37 ℃ overnight in a 5% CO2 incubator.
2. A conventional method was used to induce adipocyte differentiation.
3. The supernatant was removed and the cells were washed twice with DMEM (25 mmol/l glucose, 10% FBS, phenol red free).
5. The Lipi-series working solution (in DMEM (25 mmol/l glucose, 10% FBS, phenol red free)) was added and the cells were incubated at 37 ℃ for 24 hours in a 5% CO2 incubator.
6. The cells were observed using a fluorescence microscope.
*Dye Concentration: 2.5 µmol/L each.
Mouse liver adipose tissue (Frozen section) with Lipi Series
After adding Lipi series to the 4% PFA (PBS) fixed mouse liver adipose tissue and the tissue were incubated for overnight, and washed with PBS. Fluorescent imaging was observed by fluorescence microscopy.

Quantitative analysis
Changes in lipid droplets were examined after the addition of oleic acid or Triacsin C (acyl-CoA synthetase inhibitor) to the HepG2 cell culture medium. For analysis, the number and total area of lipid droplets per cell were computed from the images acquired with CQ1, a confocal quantitative image cytometer (Yokogawa Electric Corporation).
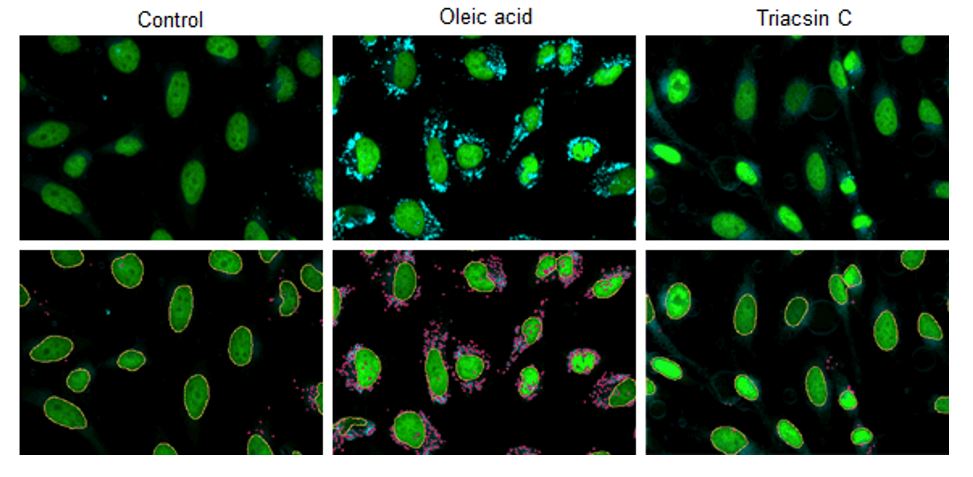
CQ1 captured images of lipid droplets with a 447/60 nm bandpass filter and cell nuclei with a 525/50 nm bandpass filter. Lipid droplets and cell nuclei were individually identified and computed the number and total area by using the CellPathfinder analysis software.
Imaging conditions:
Plate: 96 well plate, objective lens: x 20
excitation: 405 nm (Lipi-Blue), blue/488 nm (SYBR Green), Green
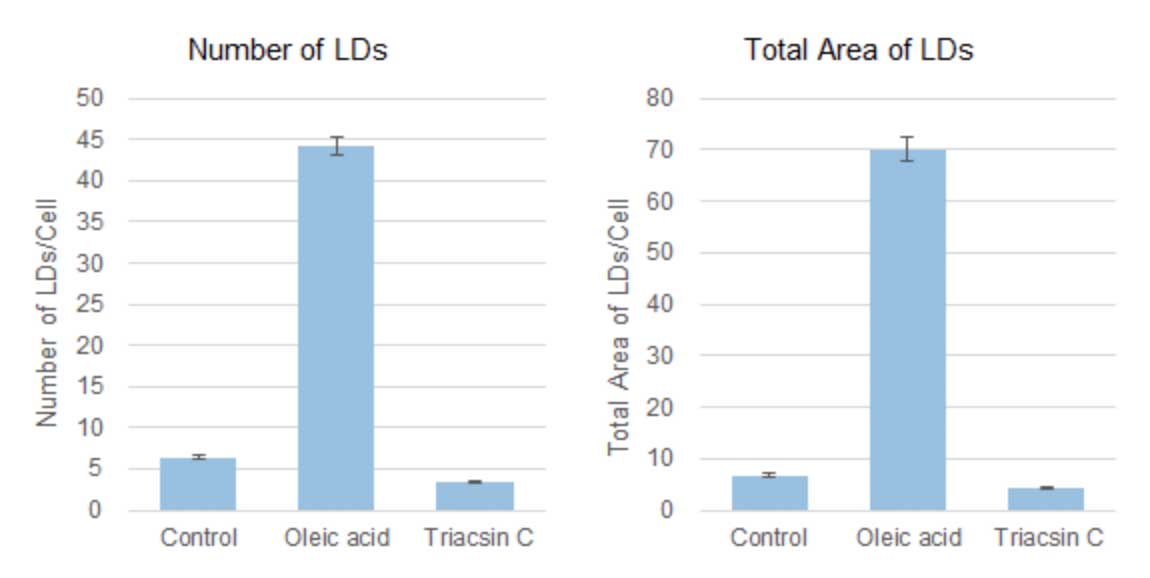
Based on the detected data of cell nuclei and lipid droplets, the number and total area of lipid droplets per cell computed were shown in the graphs below. Compared to the control value, the number and total area of lipid droplets per cell were increased 7-10 times by the addition of oleic acid, but the addition of Triacsin C inhibited lipid droplet formation and showed a 50-60% decrease.
Experimental conditions
HepG2 cells (1 x 10³ cells) were disseminated on a 96-well plate and incubated overnight. After the culture supernatant was removed, the cells treated with DMEM plus FBS only (control), DMEM plus FBS and 200 μmol/L oleic acid (Oleic acid), and DMEM plus FBS and 5 μmol/L Triacsin C (Triacsin C) were incubated overnight. Cells were then washed twice with PBS buffer, fixed with 4% PFA for 5 minutes at room temperature, and washed twice with PBS buffer again. Finally, cells were stained in the dark for 2 hours at room temperature with 0.5 μmol/L Lipi-Blue working solution, and quantitative analysis was performed through CQ1.
Related Product Information
Function: Imaging
Lipi-Blue 10 nmol LD01
Lipi-Green 10 nmol LD02
Lipi-Red 100 nmol LD03
Lipi-Deep Red 10 nmol LD04
Function: Quantification (Plate Reader, FCM)
Lipid Droplet Assay Kit - Blue 1 set LD05
Lipid Droplet Assay Kit - Deep Red 1 set LD06
Positive control
Preparing a stock solution of oleic acid
Required Reagents:
・BSA (bovine serum albumin)
・Oleic acid
・0.1 mol/L Tris-HCl (pH 8.0)
Procedure:
(1) Dissolve 0.14 g/mL BSA in 0.1 mol/L Tris-HCl (pH 8.0).
(2) Add 4 mmol/L oleic acid to a disposable centrifuge tube.
(3) Add BSA solution (prepared in step 1).
(4) Cap the tube and mix on a rotary shaker (Be sure the solution is transparent, indicating that oleic acid has been conjugated to BSA).
(4) Filter the solution prepared above (step 4) using 0.22μm filter membranes.
(5) Store oleic acid stock solution at 4˚C.
*Use the appropriate amount of oleic acid stock solution for culture medium to prepare working solution. *Oleic acid working solution cannot be stored. Please prepare the working solution immediately before usage.
Inducing lipid droplets
(1) Incubate cells for 24 hours at 37˚C in a 5% CO2 atmosphere.
(2) Add 200 µmol/L working solution (prepared from oleic acid stock solution) to culture medium and incubate for further 24 hours.